Translations: "Nederlands" |
How deadly is COVID-19 really? (Corona blog part 3)
The fear of the SARS-COV-2 virus is well established among the Dutch population. Everyone is now familiar with the images of people sitting alone in their car or on a bicycle with a mouth mask on. In the media we are pummeled time and again with stories of how deadly this virus is and that anyone can become a victim. In reality, that vision turns out to be only partially true. Time to take a look at how it works. We investigate how deadly COVID-19 actually is, not its potential impact on public health and society.
Case Fatality Rate (CFR) and Infection Fatality Rate (IFR)
In order to conduct a meaningful discussion, we must first understand the difference between the Case Fatality Rate (CFR) and the Infection Fatality Rate (IFR):
- The Case Fatality Rate or CFR is defined as the ratio between the number of deceased patients (fatalities) and the number of patients entering (cases).
- The Infection Fatality Rate or IFR is defined as the ratio between the patients who died of the virus and the total number of infected, including asymptomatic cases and undiagnosed ones.
At first glance, there may not seem to be much difference between the two values, but the difference can be huge. The IFR says something about how deadly a virus is. The CFR is nothing more than a usually quite crippled approach to the IFR. I clarify this with an example:
Imagine a entirely new virus. No one has ever seen it before and no one knows the symptoms and the lethality. At one point, doctors get sick people in. They do everything they can but a number of patients die and are registered as victims of this new virus. It is now possible for doctors to calculate the CFR. After all, they know how many patients have been brought in with the virus and how many have died. The doctors are now cry wolf as they see a relatively large number of people die from this new mysterious virus. This also happened with the new SARS-COV-2 virus. The CFR was estimated by the WHO in February this year at 2.3%.
The problem with a number like the CFR is that doctors see only the worst cases. Light cases do not even report to the GP or the hospital and are therefore never included in the doctors' calculations. The CFR is therefore often a gross overestimation of the actual lethality of a virus in a new virus outbreak. Certainly with a virus like SARS-COV-2, where more than 95% of the infections go unnoticed. The IFR is a much better indicator. At the same time, this was estimated much lower by the WHO, namely between 0.3% and 1%. Still very high but already well below the alarming CFR value communicated by most media.
The IFR cannot be calculated directly; After all, you do not know exactly the number of infected people and you need them to determine the IFR. However, there are methods to estimate IFR. The WHO occasionally updates that estimate. Let's get straight to the point: The latest estimate from the WHO is significantly lower than last February: It depends heavily on country, care policy and other circumstances, but for the IFR you arrive at a median of 0.23% for the entire population and 0.05% for people under 70 years old. By way of comparison, the IFR is estimated at 0.2% for measles. So if you're not afraid of measles, don't be here either...
Comparison with the flu
You often come across the comparison with the flu with COVID-19. The first time that this comparison was made was on March 16 by Jaap van Dissel in Nieuwsuur, who then indicated that for most people COVID-19 can be compared to a 'severe flu'. This has sparked quite a bit of discussion. On both sides of van Dissel, there are optimists who find it comparable to a mild flu and doomsday thinkers who say it is many times worse than a severe flu. Strangely enough, the media doesn't seem to be able to provide clarity here.
And when you start searching, you come to an unexpected conclusion: Strangely enough, there is no good estimate for the IFR for seasonal flu. The reason for this is given by the WHO itself: It is difficult to distinguish influenza from other lung diseases, people often die from the complications of influenza instead of influenza itself and the monitoring is incomplete and of low quality. The latter is certainly correct: From my own experience I know that if you go to the doctor with flu symptoms, there will be no testing and you will be sent home with the message 'just let it run its course'. Of course I already know this answer and unless it gets out of control I won't even bother my doctor. And so many with me. And if you don't test and don't register anything, you don't have a good idea of how seasonal flu spreads and it is very difficult to accurately determine the IFR. So making the comparison between flu and COVID-19 is actually pointless; We have no idea about the spread of flu and therefore no idea of the IFR of flu. Apparently we never really took it seriously enough to start measuring it.
We do get a possible indication, at least in terms of lethality, if we look at a recent 'severe' flu wave: In the year 2017/2018 there was a very severe flu wave. According to the figures of the RIVM, approximately 900,000 people were infected in a period of 18 weeks and there was an excess mortality of 9,500. If this excess mortality is attributable to this flu wave (and that is very likely) then we are talking about an estimated IFR of 9,500 / 900,000 x 100% = 1.05%. That's significantly higher than COVID-19's IFR of 0.23%. In other words: On average, if you got the flu in the period 2017/2018, you were over four times more likely to die than with a SARS-COV-2 infection now. If that sounds strange to you, just ask a care provider from your circle of acquaintances: The year 2017/2018 is still notorious for many care providers. Then the ICUs were also full, we had to take people abroad and regular care was postponed. If we only look at mortality, there is no reason to doubt Van Dissel's statement.
Observant readers may notice that van Dissel compares COVID-19 to a really very severe flu. Perhaps it is not fair to compare COVID-19 with the most severe flu wave in years. COVID-19 is probably still more deadly than an average flu.
Comparison with 'the risk of life'
The whole flu equation is, of course, born of people's need to be able to compare the risk of COVID-19 with risks they already know. Something comparable to the risk of influenza is 'just part of life' for many. Such a comparison may make the risks more transparent. However, flu may not be the best metric for that. First, not every seasonal flue is comparable to the other, and then we don't know the risk of death from flu at all as well as it is commonly believed. However, it would be nice if we could assign some kind of number to the risk involved that we can compare with what we do know from our own experience. I'm going to try to outline a method for that below:
Let's assume for a moment that I am infected with SARS-COV-2. How much extra risk do I run of death compared to my normal chance of death in my current year of life? If the risk of death doubles in the event of an infection, we can call that a relevant risk. But as long as a SARS-COV-2 infection does not significantly increase my risk of dying, fear of this virus is not rational. The ratio between the risk of death due to COVID-19 compared to my 'normal' risk of death is the desired measure to estimate the risk if I have been infected with the virus. It would therefore be useful if I could estimate the danger of the SARS-COV-2 virus with this metric. And the great thing is that that is possible!
Because the risk of death during a certain year of life is diligently calculated by the Dutch Statistics Agency (CBS). And meanwhile, reliable estimates of the IFR of the SARS-COV-2 virus are beginning to come available for different age groups, income classes etc. When we put those numbers together, a relative comparison becomes possible. In the graph below we see the age on the horizontal axis. The blue line is the ratio between the normal risk of death and the risk of death in as result of a given SARS-COV-2 infection for men. The red line is the progression for women:
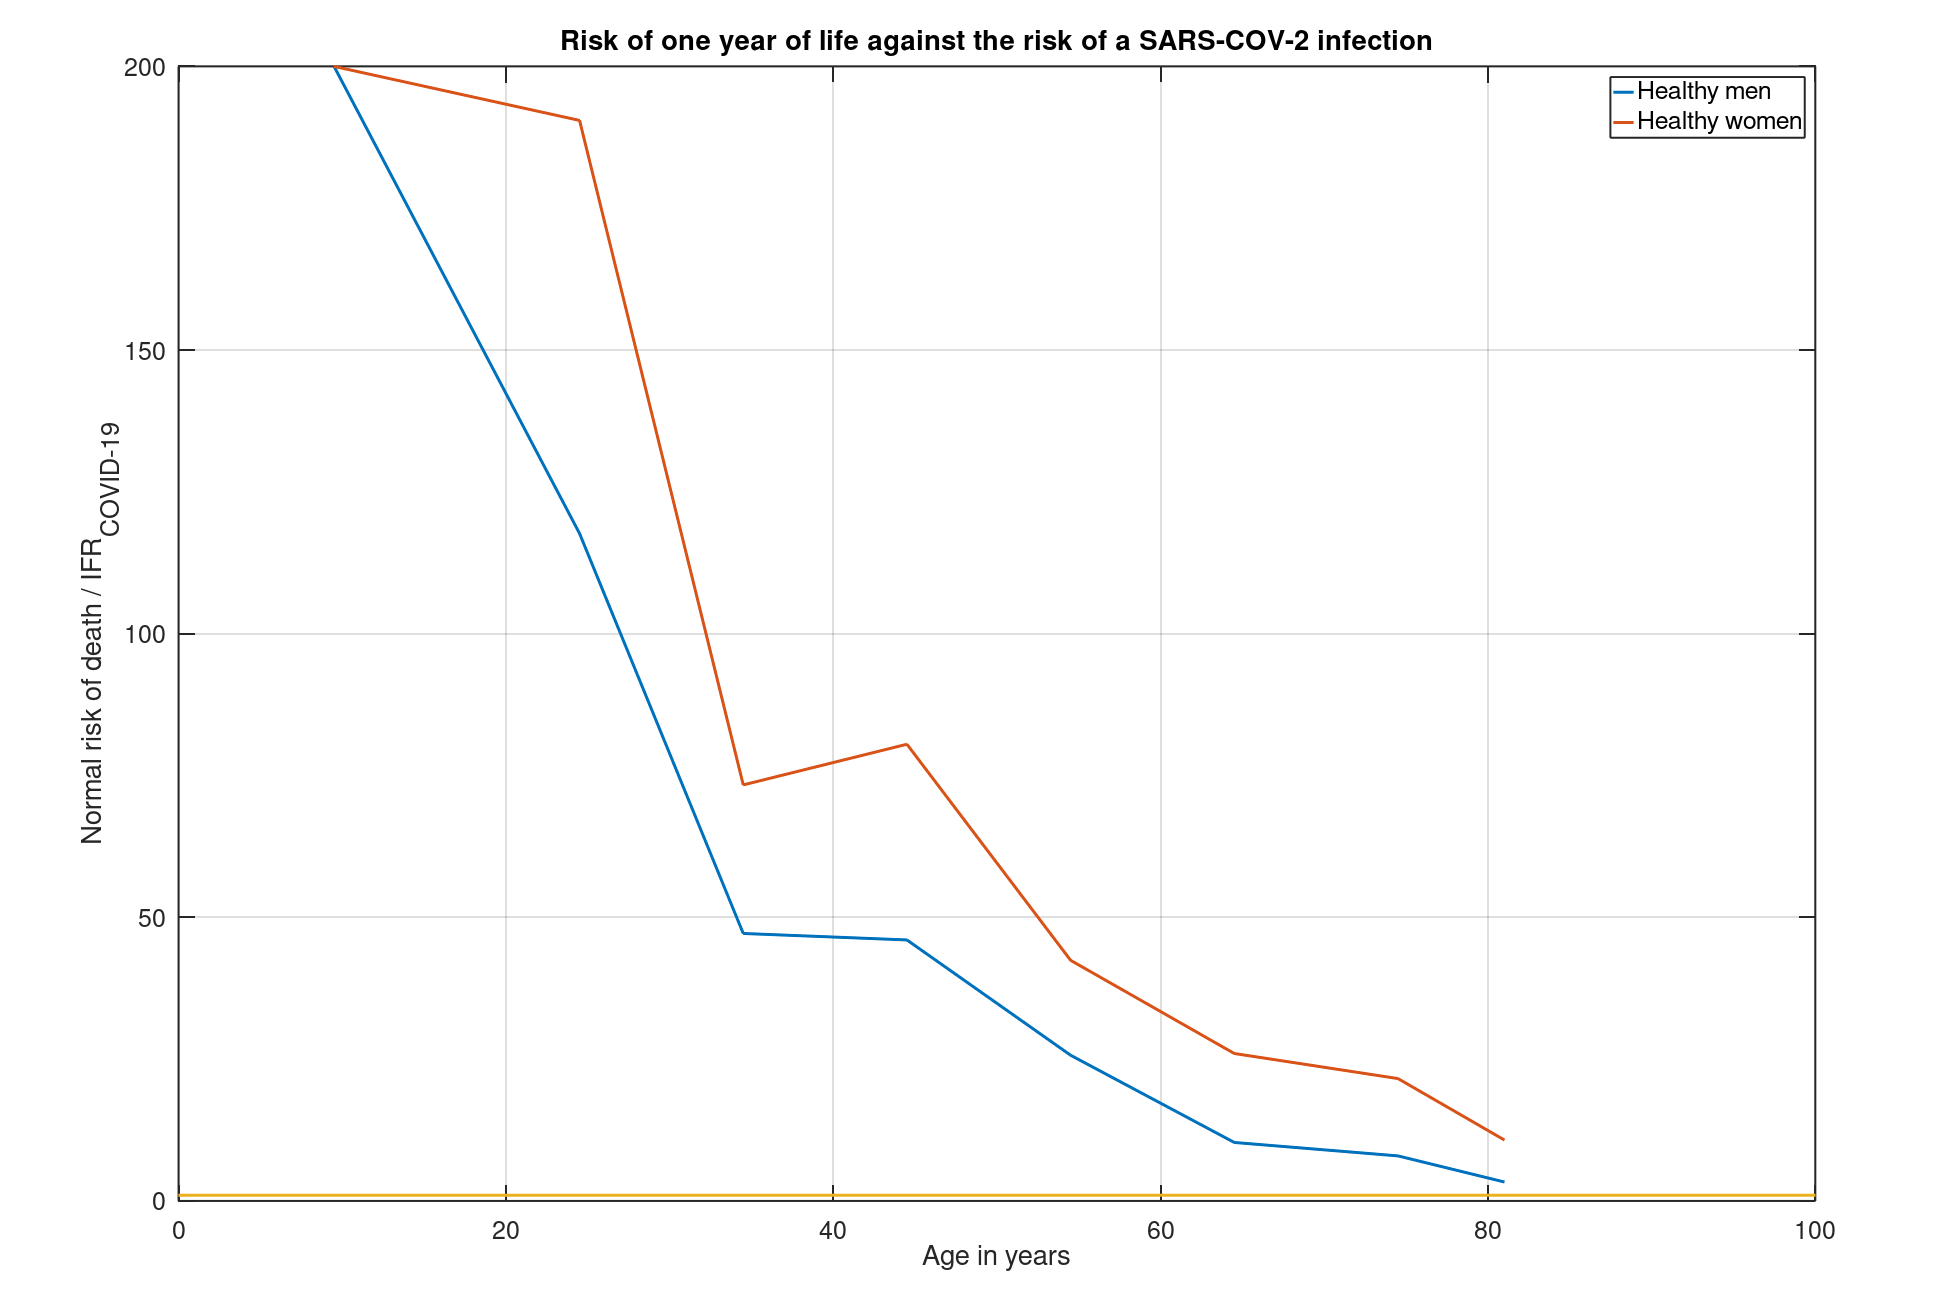
This graph shows how many times greater the chance of dying is from something other than a given SARS-COV-2 infection at a given age. For healthy men (the blue line) of around 20, a year's life is therefore about 140 times as dangerous as a given SARS-COV-2 infection. For a healthy woman of around 40 (the red line) a year of life is 75 times more dangerous. You can read the risk for your own age and gender from this graph!
Unfortunately we do not have data for the group of over 81 years old. The study used only provides estimated IFR values for the 81+ group as a whole. Hence, the graph does not progress further to the right.
It is striking that we see that both lines remain above the value 1 (represented by the yellow line), regardless of age(!). That means that for any age, regardless of gender, a given SARS-COV-2 infection is much less dangerous than one year of life. This is a reassuring thought for my father's generation, a fact that sadly enough remains completely untold by our media for the time being.
It would be a misconception to think that this reassurance comes from the (lockdown) measures taken and the effect they have on the mortality risk presented here. However, that is completely separate from this graph. The graph provides a risk estimate for when the contamination is already a fact. And that risk is therefore relatively favorable, even for the elderly. The measures may reduce the risk even further, but are not part of this analysis.
But what if you are not that healthy?
We do get a different story when we start from persons with serious medical conditions. In the following graph you can see how the picture develops for people with at least 1 indication of a so-called 'comorbidity' such as cardiovascular disease, diabetes, kidney and liver disease, etcetera:
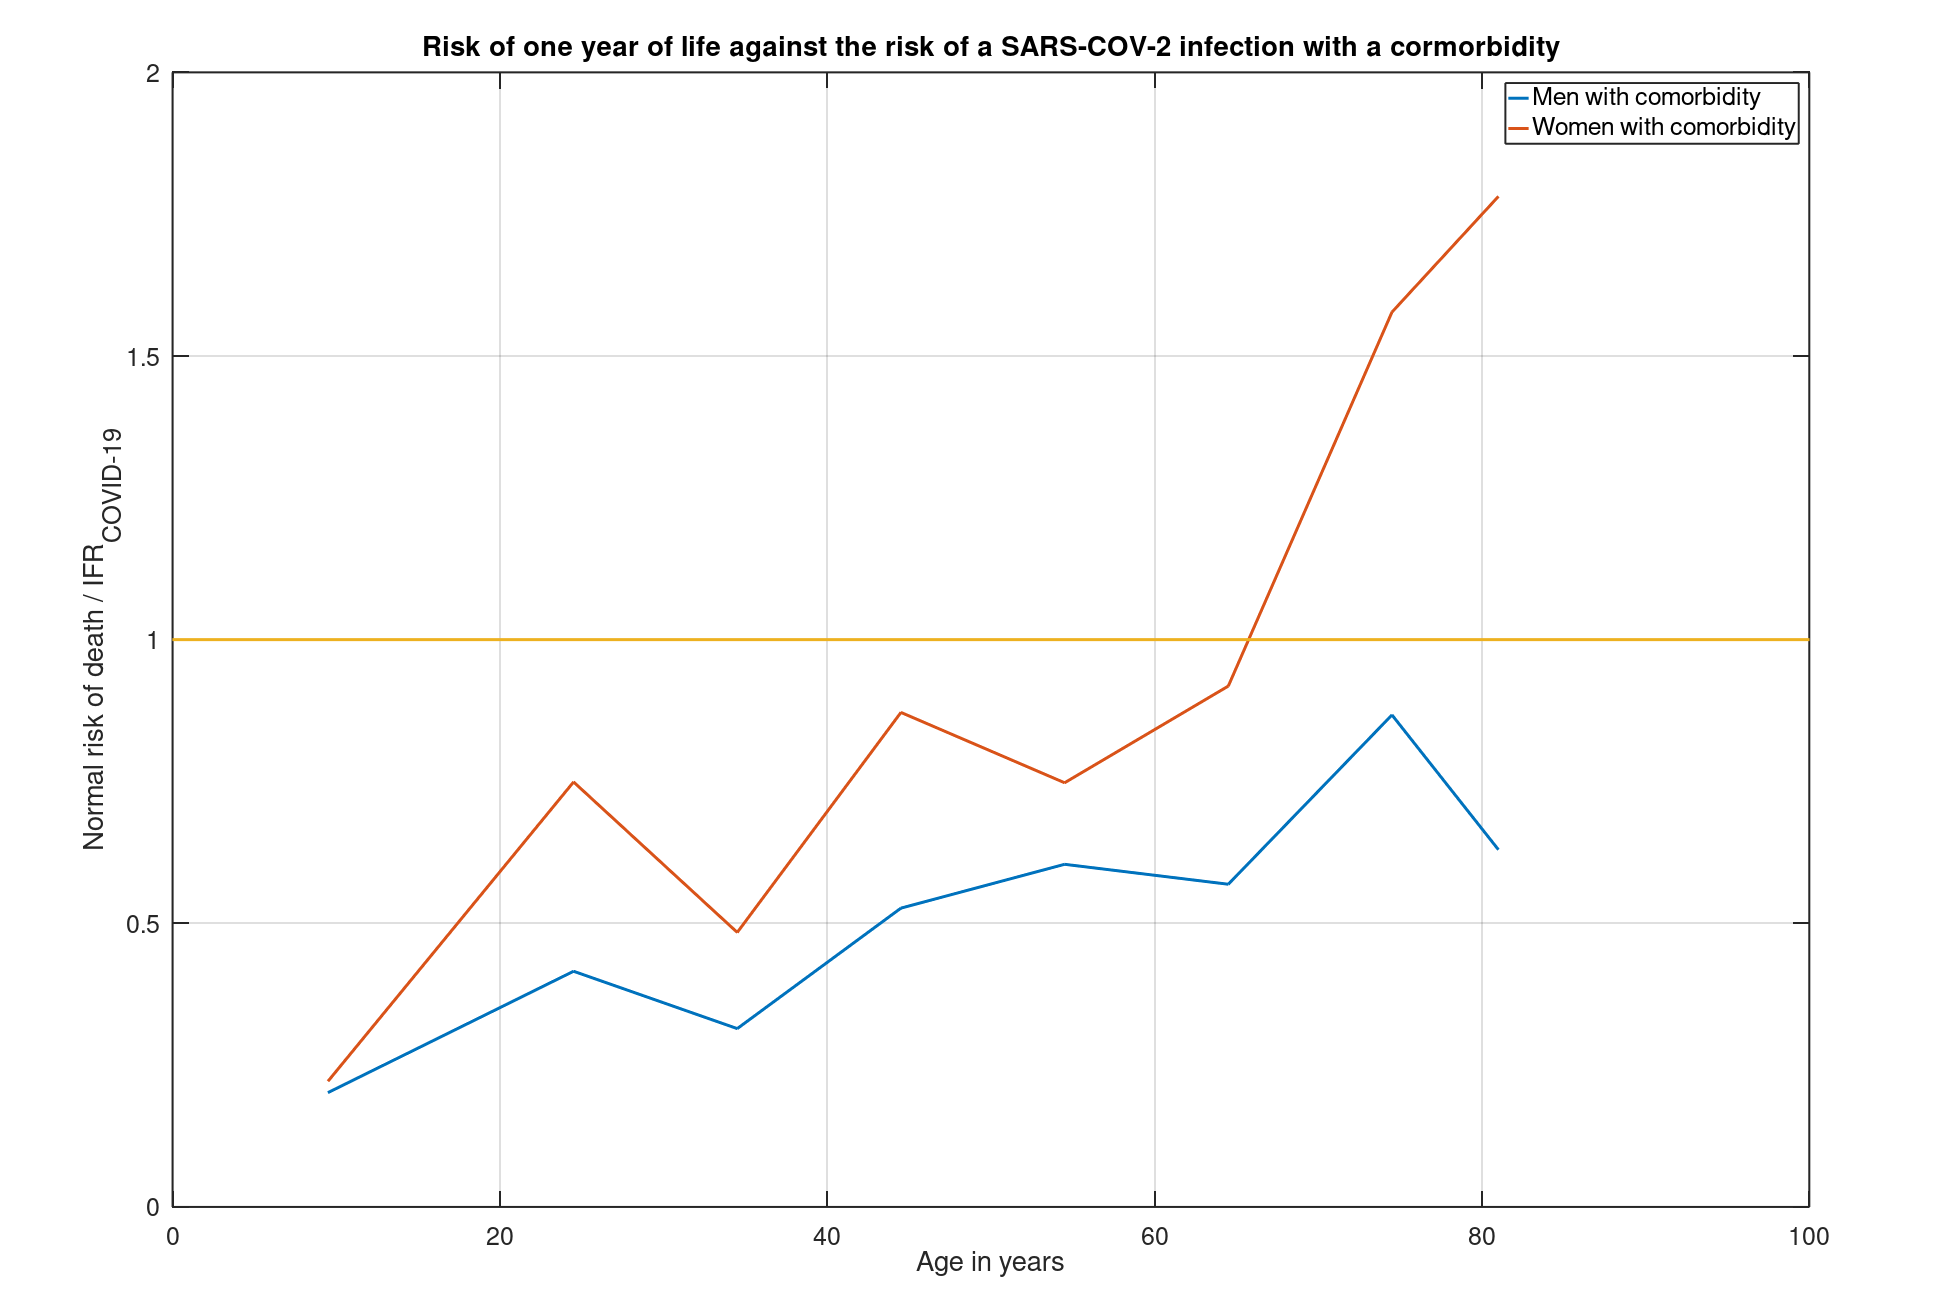
For people with comorbidity, the risks in case of a SARS-COV-2 infection increase enormously. Suddenly the harrowing truth emerges that for many people with these conditions, a SARS-COV-2 infection is more dangerous than a year of life (namely where the red and blue lines are below the yellow line). For some of them, the chance of dying in this year quadruples should they be infected by the virus! Obviously, we have identified the group to be protected; Those people with a comorbidity indication, regardless of age, are many times more at risk from a given infection than healthy people!
Conclusions
- First of all, we have seen from the above that a SARS-COV-2 infection is at least significantly less dangerous in terms of death risk than the worst flu wave we have seen this century.
- Are you relatively healthy? Then a SARS-COV-2 infection is a relatively small risk if you weigh it against the risks that normal life entails, regardless of age. At ages above 81, the risk is steadily increasing.
- For people with severe medical conditions, regardless of age, the risks are considerably higher. This is clearly the group to be protected and this group of vulnerable people can be seen as a justification for the measures taken in the past 10 months.
Additions
From comments I have received about this blog, I notice that a few points need to be clarified:
- What are the types of comorbidity that should be considered in the last graph? The authors of the article cite the following conditions as relevant comormbidity indicators: cardiovascular disease, chronic kidney disease, type 2 diabetes , cancers with immunosuppression, HIV / AIDS, tuberculosis, chronic neurological conditions and sickle cell disease.
- The last conclusion indicates that the vulnerable group is the justification for the measures taken. Whether that is proportional and how far we want to go with this is a very important part of the public debate. Hopefully I will provide a framework through this post that can be used in this discussion. Whether this very important public debate will actually take place is entirely in the hands of our media. Unfortunately, they were not that far yet. Let's hope that will soon change and they will take up their responsibility.